Behind the Statistics: Power Asymmetry in the Urban Regions

This blog is inspired by a figure (see Figure 1) that I came across when reading Thompson et al (2000)'s research about the changes in urban water use in East Africa between 1967 and 1997. 

Overall, the mean per capita water use in urban areas in East Africa decreased over the three decades. The water use from piped water sources also decreased. However, the usage of unpiped water resources increased. Mathematically, the compound annual annual growth rate (CAGR) of the unpiped water resource is 1.53% and -2.18% for piped water resources. It means that every year people would reduce their piped water usage by 2.18% as compared to last year and increase their water usage from unpiped resources by 1.53%. 

Now, let's think about what else had happened during that period. Africa went through an accelerating urbanisation process. Maps produced by OECD (see Figure 2) show that in 1970, there were only 4 countries that have 33-49 share of the urban population, no country has more than 66% urban population. However, just over two decades, the number of countries that have 33-49 share of urban population climbed to 13, two countries appeared in the 66-79 share of urban population category, and one country reached over 79% urban population. These indicate a massive inflow of migrants in the urban regions throughout the continent. Then, we all know the rest of the story. 


As there weren't sufficient affordable housings in the urban regions, many migrants resolved into informal settlements. Illustrated by Figure 3, the World Bank data shows that in East Africa in 2018, almost every country has half of the urban population living in slum areas. With more urban population, the decrease of mean per capita water use on average indicates a water scarcity problem, and the switching to unpiped water resources suggests the insufficiency of formal water supply. 


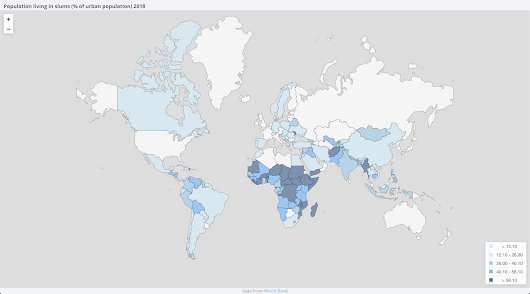
Another set of statistics (see Figure 4) provided by the United Nations shows that the proportion of the population with an improved drinking water supply and access to sanitation facilities in Africa decreased from 57 to 54 over two decades whereas there was an improvement in rural regions. Just as Joan Clos, the executive director of UN-Habitat pointed out,
"Africa is the fastest urbanising continent on the planet and the demand of water and sanitation is outstripping supply in cities." 

Figure 4. Urban and Rural Contrast of Proportion of Population (%) with improved drinking water supply & access to sanitation facilities in Africa
Visualisation: Author     Data: UN


A Case in Point 

A team of researchers analysed the water inequality problem in Lilongwe, the capital city of Malawi. They found out that the piped water supply network managed by Lilongwe Water Broad worsened water stress in poor areas of the city. In everyday practices, operators will tend to use the valves installed in the pipes to direct the water to specific areas that benefit their families or friends. They would also give higher priority to customers that can complain directly to their managers or the president. These resulted in a spatial unevenness of water supply across the city. In area 36, a low income area, for instance, people only receive less than 6h of water supply a day, and the supply is usually during night-time. 
Note: the grey shade means that these are the areas that have problematic water supply 

Connecting back to Water and Sanitation 

So how does this unevenness between the elite and the poor results in sanitation problems? The answer is sought in a case in Mumbai. McFarlane (2008) pointed out that differential infrastructure provision contributed to the high infections and parasitic diseases rate. During the colonial period, inadequate sanitation such as water supply and drainage gave rise to 58.8 per thousand death rates for the city in general. Specifically, the poor constitutes 94 per thousand death rates. These statistics highlighted the significance of piped water. Although piped water does not equal safe water and vice versa, the point is about the possibility of risk. Unpiped water is usually the groundwater, surface water, springs and kiosks. It is reported that these waters are often contaminated. The most common contaminant is E.coil, which can be found in human and animal stool

It is, therefore, worth thinking about how do E.coli goes into the water system. This leads us to my next blog, which will be on the "unmentionable human waste". 

Comments

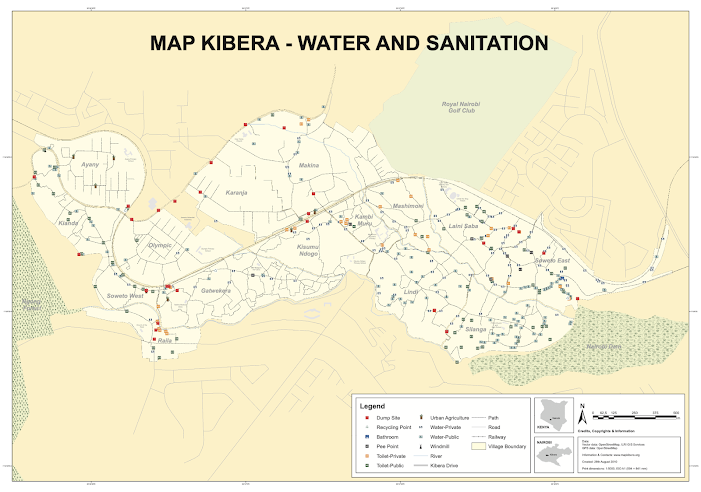
  1. Your take on explaining water and sanitation issues through statistics is really powerful in addressing the sanitation issues in Africa. Your example of Lilongwe reinforced the inequalities that are present when receiving water and therefore further emphasises that the water and sanitation problem is not clear cut and these inequalities need to be thought about (well done! :)). This blog post was very well thought out and unique as you tied urbanisation and its link to the sanitation and water issues together.

    ReplyDelete
  2. A thoughtful and well-argued post!

    ReplyDelete

Post a Comment

Popular posts from this blog

Human Waste Problems in Kampala, Uganda (Part II)

A Digital Future